I am a staunch believer of the 50% Level, which is why I incorporated it into my Fibonacci Evoke Indicator. If you’ve ever seen price “bounce right in the middle” of a previous move, you were likely looking at the 50% level in action.
It’s not technically a Fibonacci ratio. But in real trading? It’s one of the most respected price magnets on any chart.
With the Fibonacci Evoke indicator, you’re not just looking at one 50% zone, you’re getting four. These are calculated from the last 3, 7, 20, and 30 trading days. That gives you a layered confirmation most retail traders never see. And when two or three zones converge at the same price point, that’s often the kind of setup that triggers a clean breakout or a sharp reversal. Price doesn’t hesitate, it moves hard.
Want a full breakdown of how Fibonacci Evoke works and why it’s different from standard fib tools? Read the full feature guide here.
But in this blog, I’m going to walk you through the story of the 50% level. Once you see how it really works, you might not trade with anything else again.
Why the 50% Level Deserves More Respect
How to trade the 50% level like a pro in forex
If you’re wondering how to trade the 50% level like a pro in forex, you’re in the right place. This post breaks down how I use it across multiple market types, especially on pairs like EURUSD, GBPJPY, and Gold
Let’s get this straight: the 50% retracement level isn’t a Fibonacci ratio, but it’s been used by professional traders for decades, even before indicators existed.
Why? Because:
- Price often returns to the midpoint of its recent range
- It’s where buyers and sellers re-evaluate their bias
- It’s a common stop hunt zone before reversals
I’ve seen more clean trades bounce off the 50% mark, especially on pairs like EURUSD, NAS100, and GOLD; than any other Fibonacci level.
And when the timeframe is long, that zone becomes even stronger. The longer the timeframe, the more weight the 50% level carries. That’s exactly why I built the Fibonacci Evoke Indicator to factor in the last 3, 7, 20, and 30 trading days. It gives you layered confirmation, not just guesswork.
What Makes Fibonacci Evoke Different?
Most indicators only plot one swing and one set of levels.
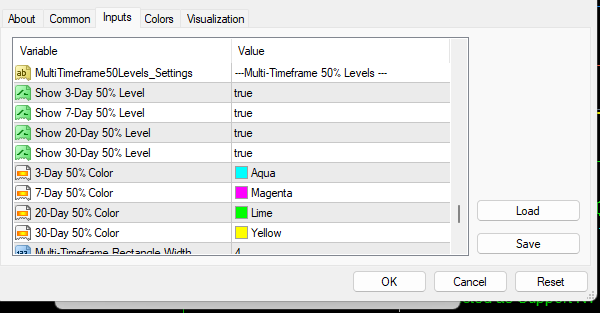
Fibonacci Evoke calculates multiple swing ranges across multiple days, then plots the 50% level for each for different trade styles:
- 3-Day Midpoint (short-term intraday swings)
- 7-Day Midpoint (great for weekly setups)
- 20-Day Midpoint (ideal for trend continuation)
- 30-Day Midpoint (position trades or confluence tracking)
Each midpoint is color-coded and labeled on your chart. You’ll literally see the clusters where price is likely to react.
You never find this type anywhere.
If you’re not yet familiar with how the indicator works in full, check out this detailed walkthrough on Fibonacci Evoke’s auto-zones, alerts, and trend filters.
How to trade the 50% level like a pro for beginners
Beginner tip: Even if you’re just starting out, trading the 50% level like a pro is possible, once you learn to wait for confluence and let your fib zones do the heavy lifting.
50% Fibonacci Level: Evoke’s Multi-Day 50% Zones Real Market Trade Examples
Just last week, I was watching several pairs I had penned down, during the London to New York overlap. The 3-Day and 7-Day, 20-Day, and 30-Day midpoints of Fibonacci Evoke performed what I will call trader’s delight. Delivering pips in profit like it usually does making the week another profitable week.
Just last week, during the London to New York session overlap, I was tracking several pairs I’d already marked. The 3-Day, 7-Day, 20-Day, and 30-Day midpoints from the Fibonacci Evoke indicator lined up beautifully, what I’d call a trader’s delight.
Price didn’t stand a chance. Clean rejections, clean profits. Each zone delivered pips like clockwork, turning the week into yet another profitable run.
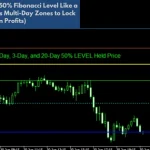
Daily 50% Zones Live Market Trade Examples
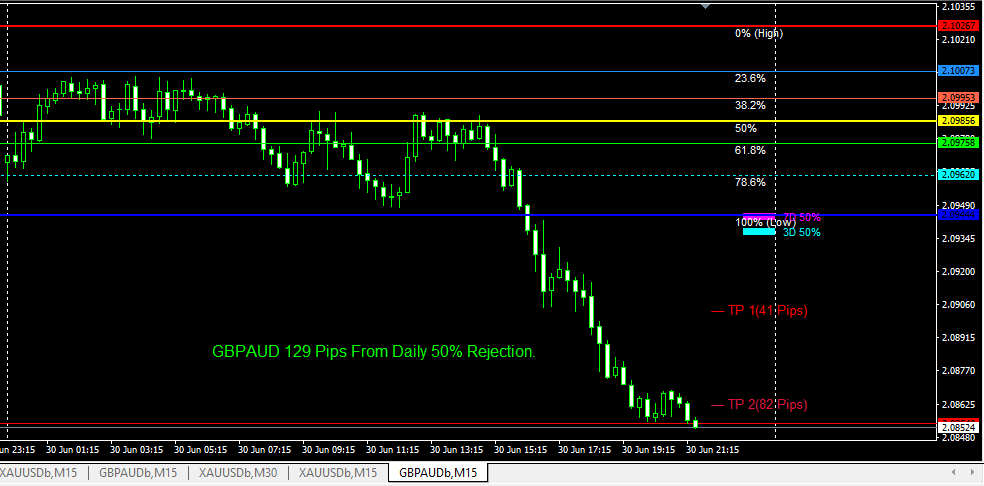
A GBPAUD chart demonstrating a successful 129-pip trade from a daily 50% rejection level, with take-profit targets at TP1 (41 pips) and TP2 (82 pips) were hit on June 30, 2025, showcasing the reversal accuracy of the Fibonacci Evoke indicator.
7-Day 50% Zones Real Market Reversal Examples
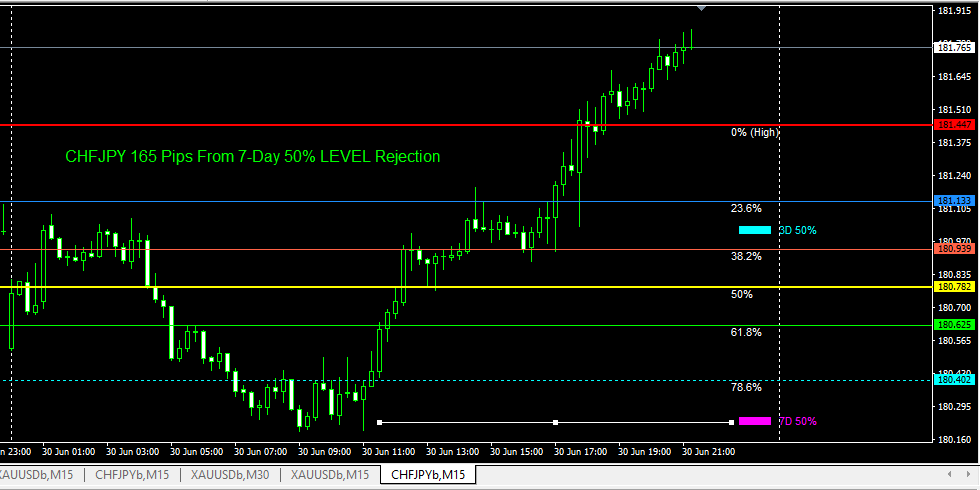
A CHFJPY chart demonstrating a significant 165-pip profit from a 7-Day 50% Fibonacci Evoke level rejection, showcasing a high-probability reversal.
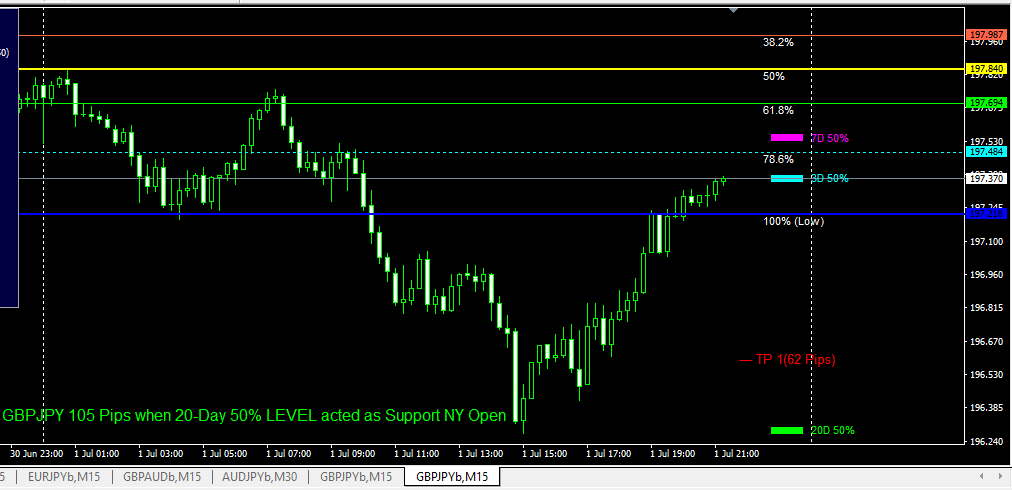
20-Day 50% Level Holding Price
The Fibonacci Evoke indicator highlighting a powerful 105-pip reversal trade on GBPJPY, triggered by a rejection from the 20-day 50% level at the NY session open.
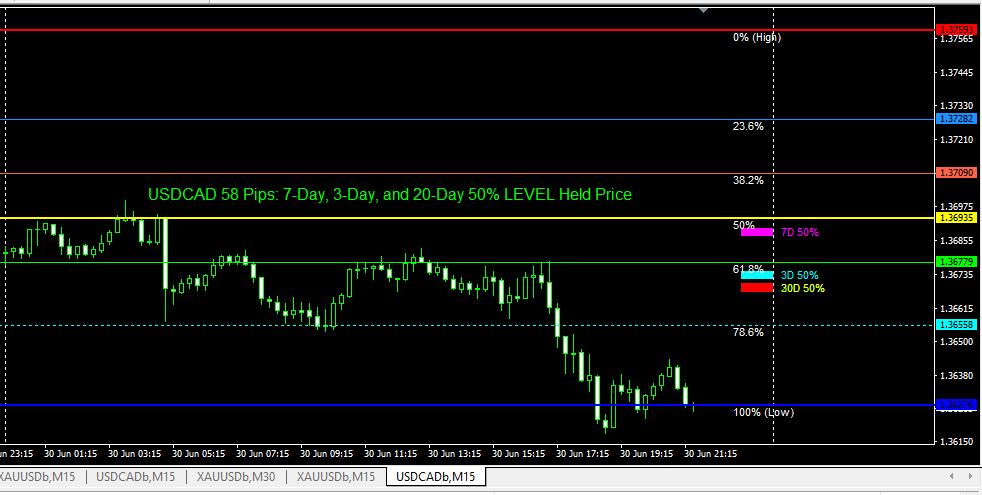
Real Market Trade Examples: 3-Day, 7-Day, and 20-Day 50% Level Convergence
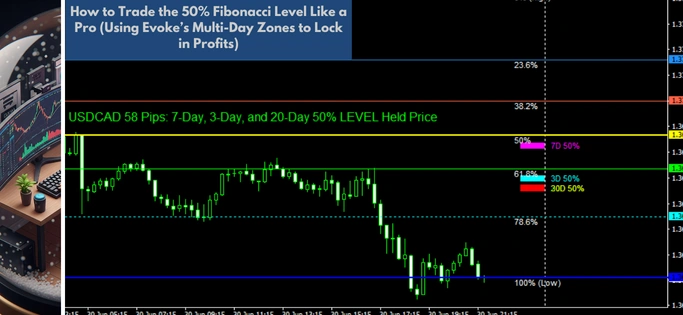
The Fibonacci Evoke indicator revealing how USDCAD price reacted to the combined strength of multi-day (7-day, 3-day, 20-day) 50% levels, resulting in a 58-pip gain.
That’s the kind of edge you get when you track multi-day memory zones that most traders don’t even know exist.
How to Use 50% Zones in Your Strategy
Here’s how I personally use them inside Fibonacci Evoke:
First Scenario: Trend Pullback Confirmation
If price is trending, wait for a pullback toward the 3D or 7D midpoint. If the zone holds, take the trade in the direction of the trend.
Second Scenario: Reversal Scouting
When 20D and 30D midpoints cluster above or below the current price, it’s often a tired trend. If the price can’t break through those levels, it’s a reversal signal.
Third Scenario: TP Targets
If I enter based on a swing fib level (e.g., 61.8%), I’ll sometimes use a midpoint zone as a secondary TP, especially if price slows or consolidates near it.
Stop second-guessing your entries. 👉 Get Fibonacci Evoke now, and trade with a structure you can trust
Types of support and resistance (How Fibonnci Evoke trade key levels)
The 50% level often acts like an invisible support or resistance zone. It’s one of the most reliable key levels you can trade, especially when it aligns with other support and resistance types like swing highs or weekly closes, or the RSI 55 line above or 45 below.
Why This Works So Well in Forex and Indices
Multi-day 50% zones work because markets remember structure, even if you don’t.
Big institutions don’t always trade off daily swings. They operate off weekly memory, layered confluence, and high-liquidity windows. Fibonacci Evoke lets you spot those zones in real time, without scrolling back through days of candles.
It’s like seeing levels the smart money is watching, before the price even gets there.
Trading on MT4, MT5, or TradingView? It Doesn’t Matter
Whether you’re using MetaTrader or TradingView, the principle stays the same:
Trading the 50% retracement level works best when it’s tied to structure and not guesswork. That’s exactly what Fibonacci Evoke delivers: automatic swing detection, multi-day fib plots, and real-time alerts that work across all platforms.
What About Reddit PDFs and “How to Trade the 50% Level Like a Pro” Threads?
I’ve seen them all. Read the posts. Skimmed the PDFs. Some are on Reddit, others on sketchy download sites that promise to help you “learn to trade the market.”
Most offer theories. Almost none give you the tools to execute; live, in the moment, with structure you can trust.
That’s why I built this tool and this guide. I am a trader myself, not just a programmer. So I know what traders want.
Not to recycle theory. But to give traders something that actually helps them profit from the 50% rule in real markets, with no fluff.
Frequently Asked Questions About the 50% Rule and Fibonacci Trading
What is the 50% rule in trading?
The 50% rule suggests that after a significant price move, the market often retraces around half of that move before continuing. It’s not a Fibonacci ratio, but it works because it reflects natural pullbacks. Fibonacci Evoke plots this level automatically using daily and weekly swing logic.
What is 50% retracement in trading?
It’s the midpoint between a swing high and low. Traders use it to catch pullbacks or continuation setups. With Fibonacci Evoke, the 50% level is dynamically calculated across 3D, 7D, 20D, and 30D swing periods, giving you confluence that most traders miss.
Want Fibonacci Evoke to handle retracements, alerts, TP zones, and more, all automatically, for you?
👉 Get Fibonacci Evoke Now, and See the Zones Most Traders Never Spot
What is Gann’s 50% rule?
W.D. Gann believed the 50% level was a key psychological threshold where trends often pause or reverse. While his methods differ from Fibonacci, the core idea is the same: the midpoint matters. Fibonacci Evoke includes it across multiple timeframes.
Do professional traders use Fibonacci?
Yes. Many institutional traders monitor fib levels for structure, entry points, and exit targets, especially in trending or corrective markets. Fibonacci Evoke takes the guesswork out by doing the drawing, alerting, and tracking automatically.
What is the 50/50 trading strategy?
This usually refers to strategies where you risk no more than 50% of your expected reward. When used with structure, like a 50% fib retracement entry and a 127.2% extension TP, it can dramatically improve your risk-to-reward profile.
What is the strongest Fibonacci retracement level?
While 61.8% is the “golden ratio,” many experienced traders, myself included, often find 78.6% and 50% to be extremely reactive, especially during high-liquidity periods. Fibonacci Evoke includes all three.
What is the Fibonacci golden rule?
It’s often used to describe the principle that price tends to retrace to Fibonacci levels, particularly 38.2%, 50%, and 61.8%, before continuing in the direction of the main trend. Fib Evoke automates this, so you can focus on execution, not drawing.
Why do so many traders fail even with tools like this?
Because they use tools passively, instead of with a purpose. Fibonacci Evoke won’t make you profitable by itself, but it gives you high-probability structure zones, real-time alerts, and confluence that manual drawing just can’t replicate. The rest is up to discipline.
Final Thoughts
Fibonacci Evoke gives you access to that hidden structure across multiple timeframes, without the hassle of drawing or recalculating. The 50% level is overlooked by traders who are obsessed with textbook fib ratios. But the pros? They know price has memory, and the midpoint is where real decisions happen.
Want to understand everything Fibonacci Evoke can do, from alerts to auto-swings to TP targeting? Check out the full breakdown here: Fibonacci Evoke: One Indicator That Can Catch High-Probability Reversals Daily
The 50% level isn’t just a midpoint; it’s where momentum shifts, traders get trapped, and smart entries reveal themselves.
Fibonacci Evoke gives you more than just one 50% retracement. It plots midpoints from the last 3, 7, 20, and 30 days, so you can spot layered confluence that most traders completely miss
Once you see how cleanly price respects these zones, you’ll wonder how you ever traded without them.
👉 Get Fibonacci Evoke Now, and See the Zones Most Traders Never Spot
Disclaimer
Fibonacci Evoke indicator is designed for educational purposes and personal trading use. It’s not financial advice or guaranteed profit tools. Trading Forex, crypto, and other financial markets carries risk and can lead to loss. Past performance, screenshots, or examples shown do not guarantee future results. Use of this tool is at your own risk. By using it, you accept full responsibility for any trading decisions or outcomes.


When I originally commented I clicked the -Notify me when new comments are added- checkbox and now each time a comment is added I get four emails with the same comment. Is there any way you can remove me from that service? Thanks!
i enjoy reading this great article, i have shared it many times on my website and started following you, Do you post more often ?? i am the owner of https://webdesignagenturbayreuth.de/ a webdesign agency in bayreuth Germany, webdesign agentur bayreuth, you can link up if you are interested. Thank you