
I catch high-probability reversals daily now, and most of them come down to Fibonacci Evoke. This indicator finds clean fib zones automatically, alerts me in real time, and takes the guesswork out of swing and intraday setups.
Before this, I spent years manually drawing Fibonacci tools. It worked, sometimes. But I kept redrawing, second-guessing, and adjusting lines that didn’t always match the market. Not because Fibonacci is flawed, but because the standard tools don’t trade the way real traders do.
That’s why I built and now rely on Fibonacci Evoke. It’s not just a drawing tool; it’s a market structure-aware, auto-reactive system that adapts to how you trade. Whether you scalp, swing, or hold multi-day positions, it reads price action and shows you where reversals are most likely, at 50%, 61.8%, or 78.6%, before price reacts.
Where Do Fibonacci Levels Come From?
You’ve probably heard of the Fibonacci sequence, a mathematical series of numbers that starts with 0 and 1, and each number after that is the sum of the two before it:
0, 1, 1, 2, 3, 5, 8, 13, 21, and so on.
This sequence appears in nature, architecture, music, and yes, financial markets.
Traders don’t use the numbers themselves. They use the ratios between the numbers, particularly:
- 38.2% (1 ÷ 2.618)
- 50% (not a Fibonacci ratio, but widely used)
- 61.8% (the Golden Ratio)
- 78.6% (the square root of 61.8%)
- 127.2%, 161.8%, 261.8% for extensions
These ratios help traders spot likely retracement zones, continuation levels, and profit targets.
That’s why tools like Fibonacci Evoke are so valuable; they turn this mathematical structure into clear, real-time price action zones you can actually trade from.
But, the whole concept behind Fibonacci trading started with one man named Leonardo of Pisa, better known as Fibonacci. In 1202, he published a book called Liber Abaci, where he introduced a sequence of numbers that would later become one of the most important mathematical patterns in nature and, surprisingly, in the markets.

What Does “To Evoke” Mean? (And Why It Fits This Indicator)
The word “evoke” means to bring something into awareness, to trigger a reaction, emotion, or memory. In trading, that’s exactly what we need: a tool that brings clarity, confidence, and reaction zones out of raw price data.
That’s why we named it Fibonacci Evoke, because it helps you see what the market is hinting at, but not always showing.
So, instead of second-guessing your fib levels, Fibonacci Evoke brings those zones forward automatically, without manual input, clutter, or delay.
So no, this isn’t Evoke Gaming or another entertainment brand. Fibonacci Evoke is built for traders who want clarity, not chaos. And that’s why we are bringing it to this Marketplace for you in the Believers Factory, because we are believers in forex trading.
Every plotted line, level, and alert is designed to evoke a reaction: either from the market or from you as a disciplined trader waiting for confirmation.
What Is Fibonacci Evoke?
Definition and Origin of the Tool
Fibonacci Evoke is a reversal-focused MT4/MT5 indicator I developed to help traders spot potential turning points with visual clarity and timing precision. It doesn’t predict price, no tool can, but it organizes the most meaningful Fibonacci levels in a way that shows you where price is most likely to stall or reverse, and when to actually act.
It’s not some magic system. It’s built on classic Fib ratios, like 78.6% and 88.6%, but with a visual twist. Zones are color-coded, and entry behavior is easier to read with it than raw Fib lines.
I made it for one reason: I wanted a visual map for reversals I could trust.
Why Most Fib Tools Are Unreliable Without Experience
Most fib tools just draw lines. They don’t read the swing structure. They don’t care about session time or liquidity. And they certainly don’t send alerts when price hits a critical level.
Fibonacci Evoke changes all that.
It analyzes the swing high and low automatically, plots levels based on the most active market periods (like the London and New York overlap), reveals the trend direction, and delivers push notifications right to your MetaTrader app when price reacts.
This is the edge I wish I had earlier.
When I first started using Fibonacci tools, I thought I had found the holy grail. The logic made sense, price pulls back to golden zones, then resumes its trend. But here’s the truth most traders don’t admit early on: it’s not the tool, it’s the timing.
I can’t count how many times I plotted the perfect Fib levels, waited for a bounce, only for price to slice through like those levels didn’t even exist. I’d react emotionally, enter too early, or worse, miss the actual reversal. That frustration made me question if I was the problem, or if the way I was using Fibonacci was flawed.
Turns out, it wasn’t just me. The tool needed more precision. That’s when I decided to rethink my entire approach, and eventually developed Fibonacci Evoke.
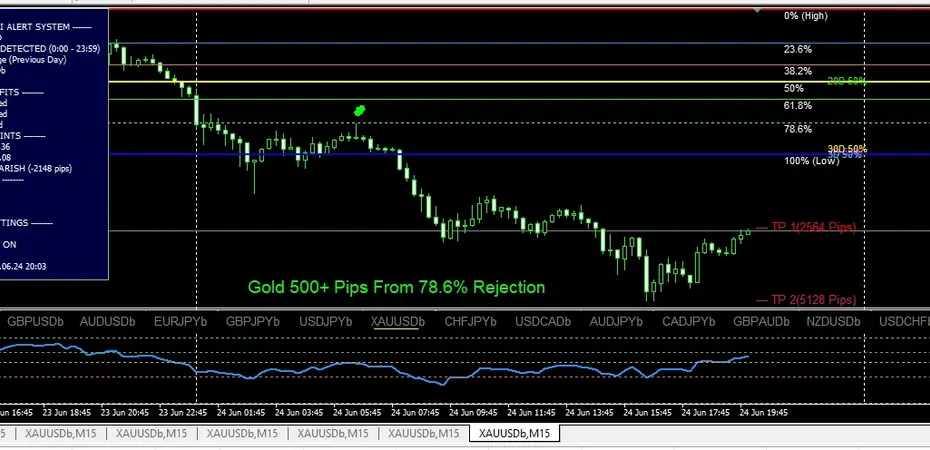
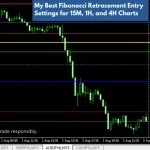
In the chart below, the Fibonacci Evoke indicator helped me identify high-probability reversals accurately on June 24, catching over 500 pips on Gold after a clean rejection from the 78.6% level.
What Makes Fibonacci Evoke So Powerful?
Let’s break this down in plain trader’s language: the killer features built into this indicator:
1. Auto Swing Detection
You don’t draw fibs anymore. The tool does it for you, using session-based logic or a weekly structure. You control the range. It handles the rest.
This dynamic feature alone has helped me cut 80% of my chart setup time just by letting Fibonacci Evoke plot the swings for me. You can’t find a tool like this on the Internet.
2. Custom Session Control
Target just the London – New York overlap (2 PM – 5 PM WAT)? You can.
Want to use the entire Asian session? Done.
This is ideal for traders who know timing matters more than timelines.
3. Take Profit Feature: TP1 to TP3 Zones with Alerts
You get three automatic take-profit zones calculated off the swing size, and alerts when price hits them. TP1, TP2, and TP3 are drawn clearly on your chart, ready for execution.
The push alerts have saved me from dozens of missed exits. They work on both desktop and mobile.
4. Real-Time Notifications
The moment price touches a fib level or profit zone, you’re notified, in-platform, on-screen, or directly on your phone. No more staring at charts for hours.
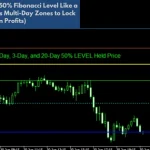
5. Multi-Timeframe 50% Zones (3D, 7D, 20D, 30D)
Fibonacci Evoke shows you the midpoint of the last 3, 7, 20, and 30 days, clearly marked on your chart. These zones act like invisible magnet levels where price often pauses or reacts (traders call that support and resistance).
Once you start watching these 50% zones, displayed with color-coded small rectangles, you’ll never unsee them. They’re real market memory. I have seen price bounds off (clean rejection) these zones and give me 100+ pips on different pairs in less than an hour.
6. Clean Visual Layout
Choose the levels you want (23.6%, 38.2%, 61.8%, etc.), color them how you like, and decide if you want price labels or not. You have the control via the indicator’s Input property.
Make it clean. Make it yours.
7. Weekly & Intraday Modes
- Scalping? Use the session mode.
- Day trading? Use the previous day mode
- Swing trading? Use weekly swing mode.
It’s built for both, for flexibility.
8. Trend Bias Display
Another built-in feature is the trend bias display on the dashboard. Fibonacci Evoke tells you whether the detected range is bullish, bearish, or flat, so you’re not trading against momentum by mistake.
9. Works on Both MT4 and MT5
Whether you’re sticking with MetaTrader 4 or using MetaTrader 5, you’re good to go.
You have a choice; only beggars don’t. LoL..
Fibonacci Evoke indicator: Real-World Examples of High-Probability Reversals and Entries.
To illustrate the power of the Fibonacci Evoke indicator, let’s look at some real-world examples directly from the charts.
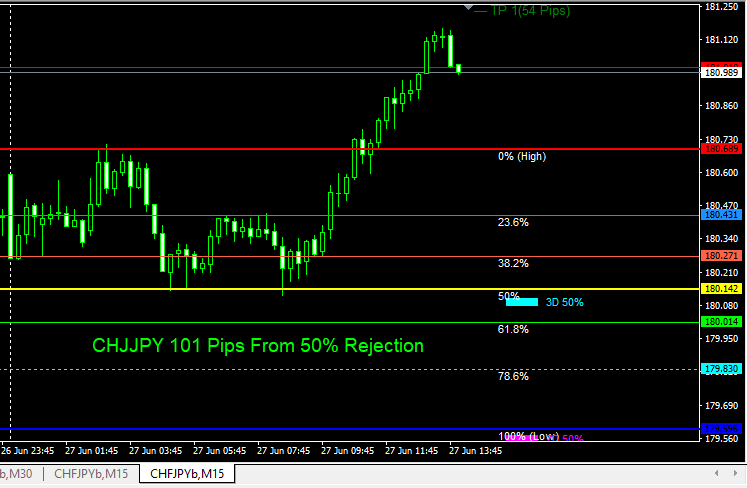
A CHFJPY trading chart demonstrating a profitable 101-pip trade from a daily 50% rejection level, showcasing the reversal-catching power of the Fibonacci Evoke indicator. Supported by 3-Day 50% levels acting as support
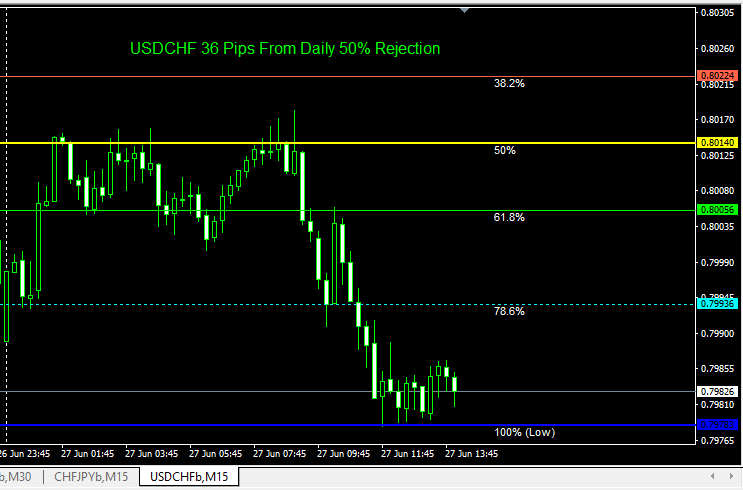
A USDCHF trading chart showing a 36-pip profit from a daily 50% rejection level, demonstrating a high-probability reversal identified by the Fibonacci Evoke indicator.
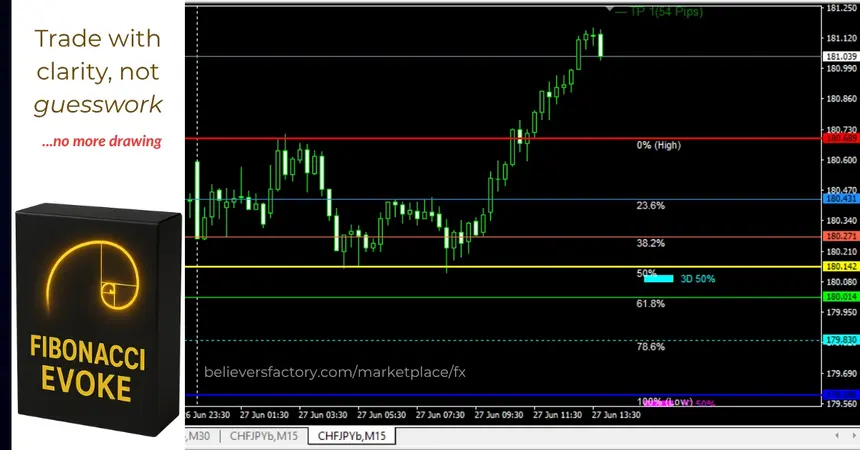
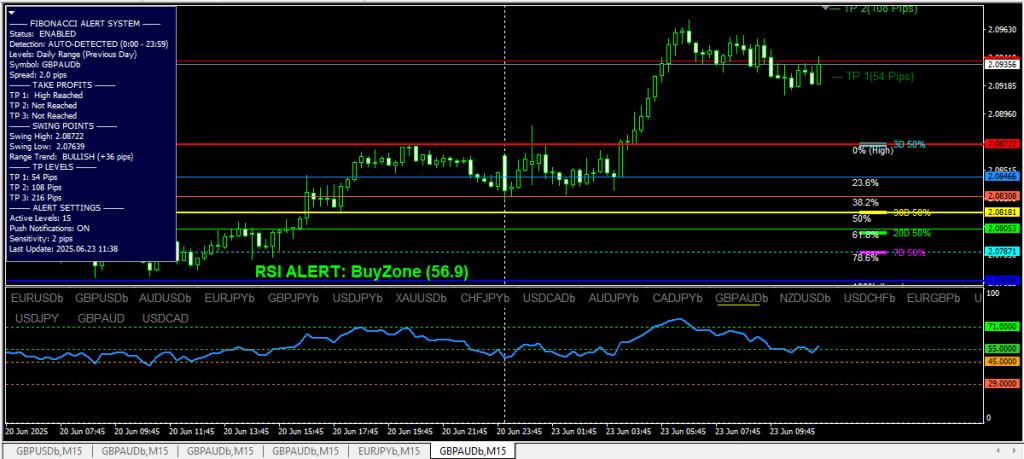
A GBPAUD chart with the Fibonacci Evoke indicator, showing an RSI ALERT and a bullish trend, demonstrating a potential buying opportunity near the 23.6% retracement level catching 54 pips TP 1. Also, almost reaching TP 2 (108 pips).
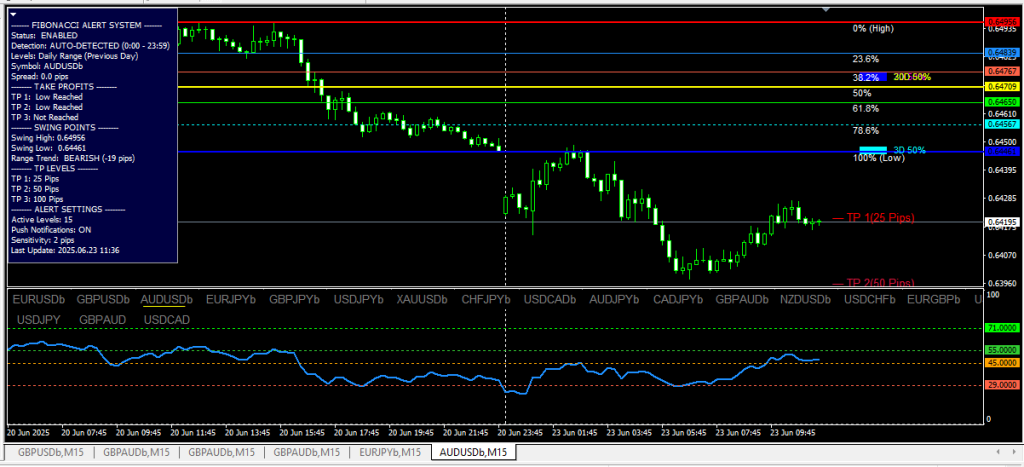
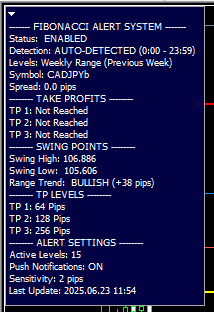
The full user interface of the Fibonacci Evoke indicator, with a dashboard displaying real-time trend analysis and swing points. Achieving TP 1 (25 Pips) and TP2 (50 Pips) on the AUDUSD pair.
As these charts prove, with the Fibonacci Evoke, you can confidently identify and capitalize on key reversal points in the market.
This tool doesn’t just give entries, it gives context.
To put these kinds of high-probability reversal strategies into practice, you need a trading platform that offers fast execution and reliable charting. That’s why we personally use and recommend HFM for our daily trading. Their low spreads and robust MetaTrader platform make them an ideal choice for traders looking to capitalize on every pip. HFM
Furthermore, for those serious about scaling their profits and accessing larger trading capital, mastering tools like the Fibonacci Evoke is a significant advantage. Many of our successful community members have gone on to trade with reputable proprietary trading firms. If you’re ready to take your skills to the next level and get funded, we highly recommend exploring opportunities with TenTrade. They offer generous funding programs that are perfectly compatible with the strategies you’ll develop using the Fibonacci Evoke. TenTrade
Now, let’s look at how to get started.
A Simple Guide to Installing and Setting Up the Fibonacci Evoke Indicator
Here’s a straightforward, step-by-step process to get your indicator up and running on your trading platform:
- Step 1: Download the Indicator File. After your purchase, you will receive an email with a download link for the Fibonacci_Evoke.ex4 file.
- Step 2: Access Your MT4/MT5 Platform. Open your MetaTrader 4 (MT4) or MetaTrader 5 (MT5) trading platform.
- Step 3: Open the Data Folder. From the top menu, go to File > Open Data Folder. This will open a new window with your platform’s files.
- Step 4: Navigate to the Indicators Folder. In the Data Folder window, double-click on the MQL4 (for MT4) or MQL5 (for MT5) folder, and then open the Indicators folder.
- Step 5: Place the Indicator File. Copy and paste the Fibonacci_Evoke.ex4 file you downloaded into this Indicators folder.
- Step 6: Refresh Your Platform. Close the Data Folder window. Back in your MT4/MT5 platform, right-click on the Indicators list in the Navigator window (usually on the left side) and select Refresh.
- Step 7: Add the Indicator to a Chart. The Fibonacci Evoke indicator should now appear in your Indicators list. Simply drag and drop it onto any chart you wish to analyze.
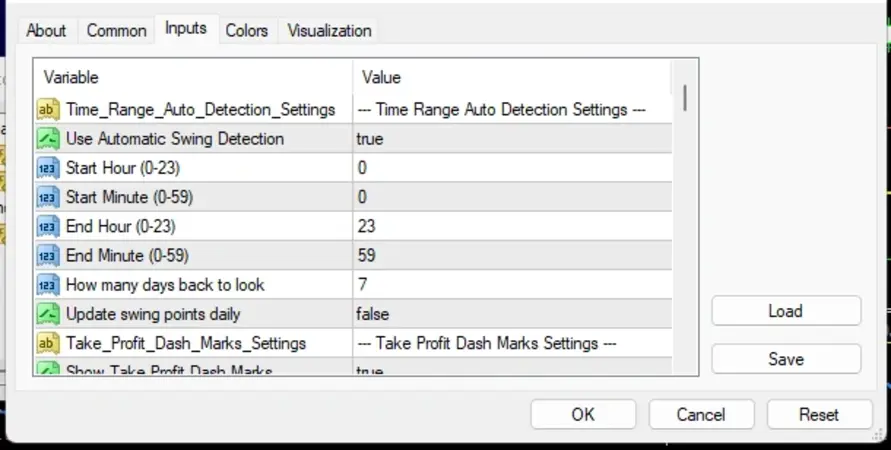
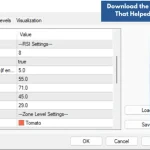
- Step 8: Configure the Settings. A pop-up window will appear with the indicator’s settings.
- Go to the Inputs tab.
- Here, you can customize features like Automatic Swing Detection and the look-back period to fit your trading style.
- You can also enable or disable alerts and take-profit dash marks.
- Refer to the user manual for a detailed explanation of each setting.
- Step 9: Click ‘OK’ and Start Trading! Once you have configured your desired settings, click ‘OK’ to apply the indicator to the chart. You will now see the Fibonacci levels, dashboards, and alerts, ready to help you catch your next high-probability reversal.
This process is as easy to follow as the logic of the indicator itself. Now that you know the levels to watch, your only job is to wait for the price reaction at those levels, then you can confidently click your buy or sell button.
What About the Fibonacci Sequence Formula?
The Fibonacci sequence formula is simple: each number is the sum of the two before it (1, 1, 2, 3, 5, 8…). But traders care about the ratios, like 38.2%, 50%, and 61.8%, derived from that sequence.
These ratios form the backbone of Fibonacci retracement and extension levels.
Fibonacci Evoke turns this formula into a usable, responsive charting system, removing the math and giving you ready-to-trade levels, live.
Best Time Frame for Fibonacci Retracement?
There’s no one-size-fits-all. But here’s what works for most traders:
- Scalpers love the 5M and 15M time frames
- Swing traders use 1H to 4H
- Position traders often work on daily or weekly charts
Fibonacci Evoke supports them all, and lets you choose if it calculates fibs based on intraday sessions or weekly swings.
New to Fibonacci Trading?
Fibonacci trading for beginners doesn’t need to be overwhelming.
Fibonacci Evoke was built with new traders in mind. You don’t need to understand every Fibonacci number or build a separate Fibonacci calculator; the tool plots everything for you.
You’ll learn faster just by seeing prices interact with clean, automatic levels.
Why the Golden Ratio Still Matters
The Fibonacci golden ratio (0.618) shows up everywhere, in nature, design, and even trading. That’s why the 61.8% retracement level acts like a hidden decision zone.
Fibonacci Evoke automatically plots this level, with alerts, so you never miss those “golden bounces.”
However, everyone likes to talk about the 61.8% retracement, and for good reason. It’s derived from the Fibonacci golden ratio, and it tends to act like a magnet during strong trends. But if you’re only trading off 61.8%, you’re missing the deeper structure.
Here’s where it gets interesting:
The 78.6% level, though not technically a Fibonacci ratio, comes from the square root of 61.8%, and it’s one of the most powerful reversal zones I’ve seen in live trading using Fibonacci Evoke.
It’s the last line before invalidation. The “do or die” level where price either respects the range or breaks it.
Fibonacci Evoke includes both these levels by default, cleanly drawn, color-coded, and optionally labeled, so you’re never left guessing where the bounce might come from.
You can choose whether to display just the 61.8%, the 78.6%, or both, depending on your trading style.
I’ve had trades reverse with surgical precision right on the 78.6%, especially on pairs like GBPJPY and GOLD.
And the best part? FE alerts you before price touches it. No need to stare at candles or count bars. You’ll get an alert. You’ll know it’s time to pay attention.
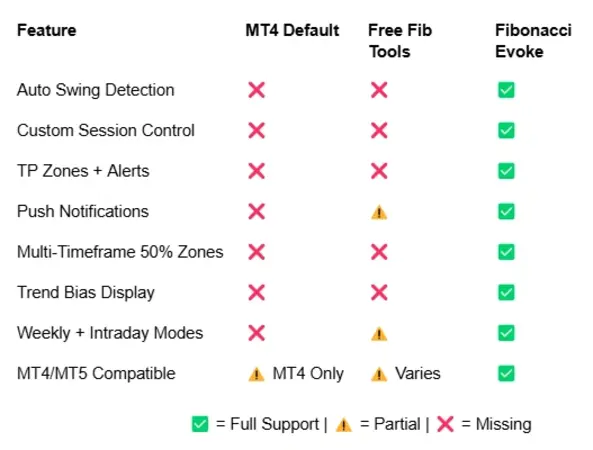
The Features That Make the Fibonacci Evoke Indicator Stand Out
This table highlights the advanced features of the Fibonacci Evoke indicator, such as auto swing detection and custom session control, compared to MT4 default tools and other free Fibonacci tools.
Frequently Asked Questions
1. What is the Fibonacci sequence formula in trading?
The formula builds a number series (1, 1, 2, 3, 5, 8…). In trading, we care about the ratios between these numbers, like 0.382, 0.5, 0.618, to build retracement and extension levels.
2. What’s the best time frame for Fibonacci retracement?
Scalpers use 5M to 15M. Swing traders prefer 1H to 4H. Position traders use daily/weekly. Fibonacci Evoke supports all of these, and even session-based modes.
3. Do I still need a Fibonacci calculator?
Nope. Fibonacci Evoke replaces it by automatically calculating and plotting retracements, extensions, and TP zones, all in real time.
4. Is Fibonacci accurate in forex trading?
When combined with session timing and market structure, Fibonacci levels are highly respected. Especially 50%, 61.8%, and 78.6%. The accuracy improves dramatically when paired with tools like Fibonacci Evoke.
Let the market speak, and trade with clarity.
Try Fibonacci Evoke Now, Launch Discount Ongoing. Ends While Stock Last »
5. What is the best auto Fibonacci indicator for MT4/MT5?’
The best auto Fibonacci indicator for MT4/MT5 is Fibonacci Evoke. It auto-detects swings, draws clean zones, and updates in real time without redrawing or cluttering the chart.
6. How do I get alerts for Fibonacci levels?
Just install the indicator on your MT4/MT5 chart, open the settings panel, and turn on the alert options, pop-up, sound, or push. Once price touches any of the fib zones like 50%, 61.8%, and 78.6%, you’ll get notified instantly, no matter what pair or timeframe you’re trading.
7. How does Fibonacci Evoke work?
It works by detecting valid swing highs and lows, drawing Fibonacci retracement and extension zones automatically, and providing alerts when price approaches key levels.
8. Can I use Fibonacci zones for intraday trading?
Yes, Fibonacci Evoke is built for intraday trading. The auto-zones work well on 15M, 1H, and 4H charts, especially during high-volume sessions like London and New York.
What’s Mozart Got to Do with Fibonacci?
Surprisingly, a lot. Mozart’s compositions reportedly followed the Fibonacci structure. The idea? Patterns and ratios feel natural. That applies to music and markets.
That same natural flow is what Fibonacci Evoke is designed to detect on your charts. Fibonacci Evoke makes you feel the pulse of Price Action.
Fibonacci Evoke: Auto Zones + Fib Levels You Can Actually Use Pricing
Starter – 1 Month ($21)
- Auto Fibonacci Retracement/Extension Zones: ✅
- Multi-Timeframe 50% Boxes (Week/Day/3-Day): ✅
- 78.6% Recovery Signal (With Alert): ✅
- Pop-up + Sound Alerts: ✅
- No Repaint, Real Price Swing Detection: ✅
- MT4 + MT5 Compatibility: ✅
- Free Updates: ⚠️ Limited
- Support Access: ⚠️ Basic
- Avg. Monthly Cost: $21.00
Standard – 3 Months ($57)
- Auto Fibonacci Retracement/Extension Zones: ✅
- Multi-Timeframe 50% Boxes (Week/Day/3-Day): ✅
- 78.6% Recovery Signal (With Alert): ✅
- Pop-up + Sound Alerts: ✅
- No Repaint, Real Price Swing Detection: ✅
- MT4 + MT5 Compatibility: ✅
- Free Updates: ⚠️ Limited
- Support Access: ✅ Priority
- Avg. Monthly Cost: $19
Pro – 10 Months ($179)
- Auto Fibonacci Retracement/Extension Zones: ✅
- Multi-Timeframe 50% Boxes (Week/Day/3-Day): ✅
- 78.6% Recovery Signal (With Alert): ✅
- Pop-up + Sound Alerts: ✅
- No Repaint, Real Price Swing Detection: ✅
- MT4 + MT5 Compatibility: ✅
- Free Updates: ✅
- Support Access: ✅ Priority
- Avg. Monthly Cost: $17.90
Lifetime Access – One-Time Payment ($279)
- Auto Fibonacci Retracement/Extension Zones: ✅
- Multi-Timeframe 50% Boxes (Week/Day/3-Day): ✅
- 78.6% Recovery Signal (With Alert): ✅
- Pop-up + Sound Alerts: ✅
- No Repaint, Real Price Swing Detection: ✅
- MT4 + MT5 Compatibility: ✅
- Free Updates: ✅
- Support Access: ✅ Priority
- Avg. Monthly Cost: 💸 One-time
Limited-Time Offer
Get Fibonacci Evoke Today and You’ll Receive:
- Lifetime Access (MT4/MT5 Compatible)
- Free Setup Guide (PDF)
- Instant Notifications (Desktop + Mobile)
- Custom Visual Controls
Why I Switched From Traditional Fib Tools
My Journey Before Using Evoke
Back in 2007, I was introduced to forex by a friend. It was overwhelming, to say the least. Nothing clicked, so I stepped away. Fast forward to 2018, I returned, more determined, but still getting wrecked by fake Fib signals.
One day, I saw on the news that South Africa had entered a recession. I rushed to trade the USDZAR pair. Within minutes, I was up $500. I felt unstoppable.
The next day, I went back in.
This time, price flipped on me. I didn’t wait for confirmation. I lost not only the previous day’s profit but a large chunk of my capital too.
I realized something right there: price levels are not enough, you need timing and behavioral confirmation. That failure triggered the search that led me to build Fibonacci Evoke.
Final Thoughts
Most traders are still drawing fib levels manually, missing opportunities, reacting late, and letting emotion lead.
Fibonacci Evoke flips that.
Fibonacci Evoke helped me take the guesswork out of reversals. It doesn’t replace your strategy, it supports it visually. I built it for myself first, then made it available to others who were tired of guessing or reacting emotionally at every bounce.
It reads the market for you, automatically detects the swing high and swing low, draws precise zones in real time, sends alerts, and shows you trend context, all without error.
If you’re serious about improving your timing and entry logic, it’s a tool worth trying.
Whether you’re scalping NAS100, swinging EURUSD, or just started trading, this tool gives you a clear edge every trading day.
👉 Try Fibonacci Evoke Now, and Let Your Charts Speak with Precision
💳 Crypto Payments Alternatives
Prefer to buy with crypto? We’ve got you covered.
We accept cryptocurrency payments via our secure checkout system.
To use this option, simply make a request, and you’ll receive the wallet address with the exact amount and currency details.
Take Action Now
If you’re still drawing fibs by hand, stop.
Fibonacci Evoke brings automation, accuracy, and decision clarity to your chart. You’ll see swing structure. You’ll track multi-day 50% zones. You’ll exit with confidence, not emotion.
You’re not just getting levels. You’re getting:
- Alerts.
- Swing clarity.
- Session-based insight.
- And a cleaner way to catch high-probability setups.
If you trade with Fibonacci, or want to, Fibonacci Evoke is the tool that makes it usable.
Stop guessing. Let the chart show you the pulse of the market.
Get Fibonacci Evoke, and Trade Smarter Today »
This post may contain affiliate links, which means if you make a purchase through our link, we may earn a commission at no extra cost to you.
Disclaimer
Fibonacci Evoke is an MT4/MT5 indicator built to assist with identifying Fibonacci-based reversal zones. While it can improve clarity and speed in your analysis, it does not ensure profits or prevent losses. Trade only with capital you can afford to lose.


Risk management is key in online gaming! Seeing platforms like kkkl login games adapt with AI for recommendations & fast loading is smart. It’s about responsible enjoyment & a better user experience, especially with diverse options!
hi!,I really like your writing very a lot! share we keep in touch extra about your post on AOL? I require a specialist in this house to solve my problem. May be that’s you! Looking ahead to look you.