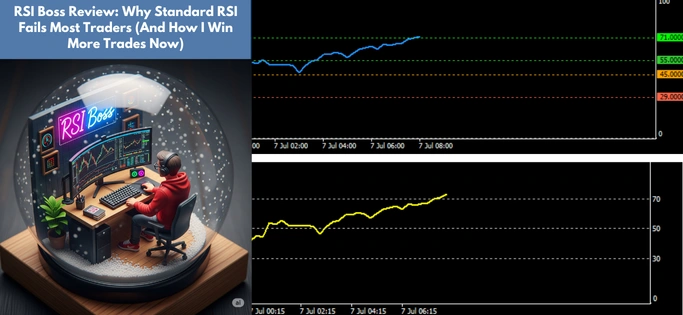
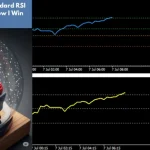
Most RSI indicators are either too noisy or too basic. I’ve tested dozens over the years, some repaint, some lag, and many just flood your screen with false signals. That’s why I built RSI Boss.
This isn’t just a tweak to the classic 70/30 setting. RSI Boss runs on both MT4 and MT5, uses adaptive midzones (45/55) to track real momentum shifts, and comes with a 9-timeframe dashboard to confirm entries before you commit. You’ll get clean alerts when real rejection zones form, no more guessing, no more chasing shadows.
I use RSI Boss daily in my own trading, especially on Gold, Nasdaq, and EURUSD, and it’s helped me avoid the kind of fake setups that used to eat up my confidence. If you’ve been looking for an RSI indicator that actually fits the way markets move now, this is worth your attention.
Why I Built RSI Boss
I’ve used the Relative Strength Index (RSI) since 2008, across bull markets, flash crashes, and everything in between. It’s a solid indicator, but let’s be honest: the default RSI is basic. It gives you 30, 70, and a middle line at 50. That’s it.
And that’s the problem.
As markets got faster and more volatile, especially on lower timeframes like 55-minute or 15-minute charts, the RSI’s simplicity started costing me precision. I needed something smarter.
So I started experimenting. What if I could split the 50 line into zones? What if RSI could confirm across multiple timeframes? The result was RSI Boss, a modified RSI that uses adaptive mid-zones (45 and 55) and a 9-timeframe simultaneous confirmation dashboard.
That small adjustment gave me a much clearer read on trend strength and momentum shifts (filtering out more noise). It was like going from a basic thermometer to a thermal camera. Same idea, but now I could see what actually mattered.
This is why we named it RSI Boss. It doesn’t just track momentum. It tells you who’s really in control.
3D packaging mock-up of the RSI Boss indicator with electric purple and neon cyan accents design, symbolizing institutional-grade precision for technical traders.
What Is the RSI Formula?
For those who like to understand what’s under the hood, here’s the classic RSI formula:
RSI = 100 – (100 / (1 + RS))
Where:
- RS = Average Gain over N periods / Average Loss over N periods
- N is typically 14, but RSI Boss lets you customize this.
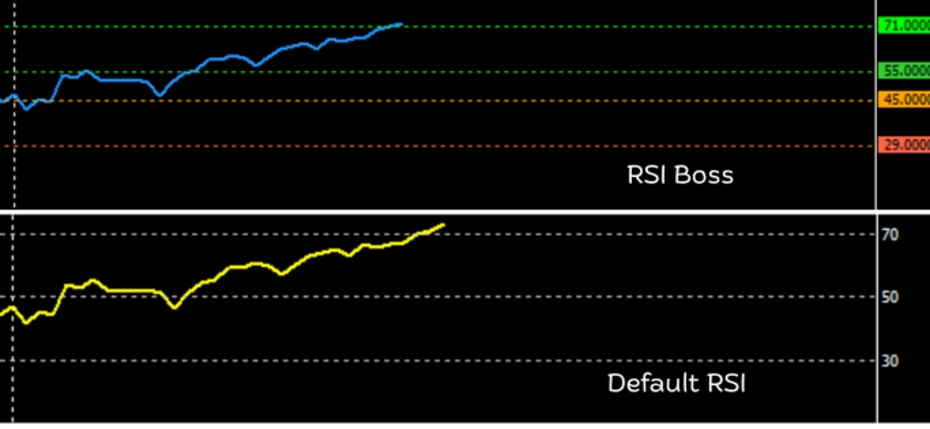
Even though the formula is the same, RSI Boss is about how the results are interpreted visually. The line levels, 45 / 55 in the middle and 29 / 71 at the edges, give you zones, not just a single “buy or sell” threshold.
Feature Breakdown: What Makes RSI Boss Different?
Here’s the truth: the regular RSI you’ve been using has three zones: 30, 50, and 70. The idea is to track momentum. But that 50 line? It’s like a rough sketch of trend balance, not a precision tool.
RSI Boss slices that 50 into two surgical levels: 45 and 55.
It’s a small change. But like in chess, small moves win the game.
Let me break down what each of the RSI Boss levels does, and how I personally use them in both scalping and swing trading.
1. 45 and 55: Splitting the 50 Default RSI Zone
Most RSI tools give you a flat 50 as the midpoint. RSI Boss slices this into 55 (bullish bias start) and 45 (bearish bias weakening), giving you an early heads-up when trends are shifting subtly. Everything in the middle is natural.
Why does that matter?
Because in the default RSI, price often reacts near 50, but not always at 50. Splitting that zone gives you more clarity. I’ve caught trend continuations and hidden reversals days before traditional RSI users even flinched.
With the default RSI, you’d assume the trend has shifted into a downtrend. But RSI Boss makes it clear: the market is in no man’s land. Without RSI Boss, you might have entered a sell trade based on a false signal from the standard RSI.
2. 29 and 71: Redefined Oversold and Overbought
Instead of the usual 30/70, RSI Boss gives you 29 and 71 as default settings because real price extremes rarely respect round numbers with RSI. These custom thresholds reduce false signals, especially in volatile or ranging markets.
Plus, the logic of the RSI Boss indicator makes the 29 and 71 a solid level.
In my own trading, I’ve used 29 as a re-entry point after a short correction, and 71 as a profit-lock signal when things are too hot to hold.
3. Scans All 9 Timeframes Simultaneously
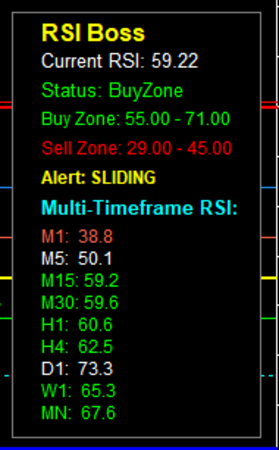
With RSI Boss, you don’t just get RSI readings, you get a full market structure scan across M1 to Monthly (all 9 timeframes), all in one glance. It shows you exactly where momentum is building, where it’s oscillating, and when multiple timeframes are lining up for high-probability trades.
This means no more switching between charts or second-guessing your setup. When three or more timeframes align in the same zone, you get instant confirmation, and that’s your green light to act.
Whether you scalp or swing trade, this feature alone saves time, removes doubt, and gives you a real edge.
4. Works Across All Timeframes and Assets
I’ve used this on crypto scalping (5-minute BTC/ETH), swing trades (4H GBPJPY), and even on prop firm challenge accounts where every entry counts.
Whether you trade Forex, indices, metals, or crypto, it adjusts without breaking down.
RSI Boss isn’t just for scalpers. Position traders love the 45/55 mid-zone for timing scaling entries on daily charts.
Which Time Frame Is Best for RSI Indicator?
It depends on your trading style:
- Scalpers benefit from the 1M and 5M charts where RSI Boss picks up micro-shifts.
- Day traders find sweet spots in 15M, 30M, and 1H.
- Swing traders and position traders use the 4H and Daily to confirm the bigger picture.
What’s powerful about RSI Boss is the multi-timeframe dashboard. You don’t need to switch charts. You can literally see how the RSI is behaving across five timeframes, right there on your chart.
RSI Boss vs. Other RSI Tools
| Feature | Standard RSI | Custom RSI (Reddit/TV) | RSI Boss |
| Midline | Flat 50 | Custom only via code | 45/55 by default |
| Entry Precision | Medium | Mixed | High (multi-zone logic) |
| Timeframe Support | All | Depends on version | All |
| Alerts | Limited | Sometimes | Push + MT4/5 built-in |
| Optimized for Scalping | ❌ | ❌ | ✅ |
| Works with Prop Firm Risk Rules | ❌ | ❌ | ✅ |
How to Read RSI Correctly?
Here’s the common mistake: Most traders treat RSI like a yes / no trigger, “above 70, sell,” or “below 30, buy.” That’s not how the pros use it.
With RSI Boss:
- 45 – 55 zone = no-trade zone: You avoid chop and fakeouts.
- 29 – 45 = building bearish pressure
- 55 – 71 = building bullish pressure
- Extreme zones = potential reversals or continuation setups
This structure helps you time entries with better risk-reward, especially when combined with price action.
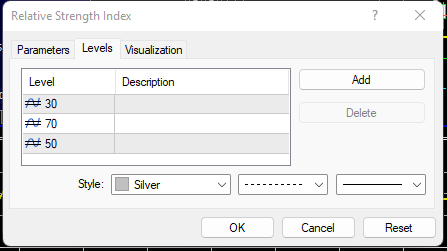
Side-by-side Comparison of RSI Boss vs Regular RSI Input property
RSI Boss Input property
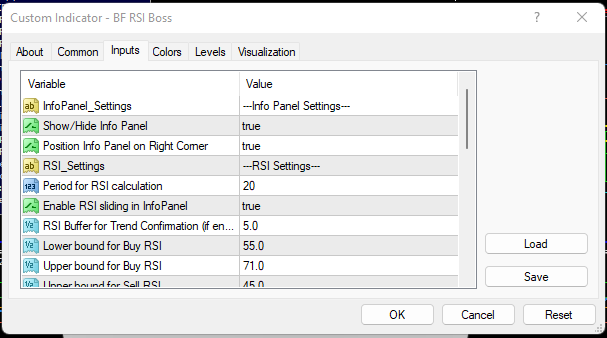
Regular RSI Input property
Which Indicator Confirms a Trend?
RSI on its own doesn’t confirm a trend; it shows momentum. But RSI Boss becomes a trend confirmation tool when paired with:
- Moving Averages (e.g., 21 SMA or 50 SMA, or 144 SMA)
- Structure breaks (Fibonacci Evoke)
- Multi-timeframe confluence
Combine RSI Boss with a 27 SMA and structure-based S/R levels like Fibonacci Evoke. That combo confirms trend continuation far better than RSI alone.
For example, if price bounces off the 78.6% Fibonacci Evoke level and RSI Boss confirms all timeframes are above 55, I’m confident the bullish signal is valid.
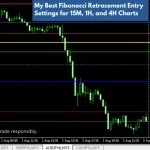
Access the Fibonacci Levels Indicator That Improves My Entries
What Is the Best Indicator for Entry and Exit?
There’s no universal “best” indicator, but RSI Boss gets close when used properly. Here’s how I use it:
- Entry: When RSI crosses above 55 (bullish) or below 45 (bearish) with price action confirmation.
- Exit: When RSI reaches 29 or 71 zones, and price begins to stall or reverse.
Pair that with your Fibonacci Evoke levels, and you’ll sharpen both entries and exits.
Frequently Asked Questions About RSI Boss vs. Standard RSI
What is the 70 30 rule in RSI?
The classic oversold/overbought rule. But RSI Boss tweaks it to 29 / 71 for better precision in real-time markets.
Is RSI 100% accurate?
No indicator is. But the RSI Boss indicator reduces noise and improves signal quality by splitting midzones and customizing thresholds.
Can I trust RSI?
Trust it, if you understand its flaws. RSI Boss was built to fix the most common ones: false reversals, lagging signals, and flat 50 lines.
What is the best RSI setting for a 5-minute chart?
In my experience? RSI Boss with 14-period and the 29/45/55/71 config. It gives you sharp intraday entries and lets you ride momentum longer.
RSI Boss Plans: Multi-Timeframe RSI Zones That Actually Work
Starter – 1 Month ($21)
- Adaptive RSI Zones (29/45/55/71): ✅
- Real-Time Pop-up + Sound Alerts: ✅
- Multi-Timeframe Confirmation (9 TFs): ✅
- No Repaint, Works on All Pairs: ✅
- MT4 + MT5 Compatibility: ✅
- Free Updates: ⚠️ Limited
- Support Access: ⚠️ Basic
- Avg. Monthly Cost: $21.00
Standard – 3 Months ($57)
- Adaptive RSI Zones (29/45/55/71): ✅
- Real-Time Pop-up + Sound Alerts: ✅
- Multi-Timeframe Confirmation (9 TFs): ✅
- No Repaint, Works on All Pairs: ✅
- MT4 + MT5 Compatibility: ✅
- Free Updates: ⚠️ Limited
- Support Access: ✅ Priority
- Avg. Monthly Cost: $19.00
Pro – 10 Months ($179)
- Adaptive RSI Zones (29/45/55/71): ✅
- Real-Time Pop-up + Sound Alerts: ✅
- Multi-Timeframe Confirmation (9 TFs): ✅
- No Repaint, Works on All Pairs: ✅
- MT4 + MT5 Compatibility: ✅
- Free Updates: ✅
- Support Access: ✅ Priority
- Avg. Monthly Cost: $17.90
Lifetime Access – One-Time Payment ($279)
- Adaptive RSI Zones (29/45/55/71): ✅
- Real-Time Pop-up + Sound Alerts: ✅
- Multi-Timeframe Confirmation (9 TFs): ✅
- No Repaint, Works on All Pairs: ✅
- MT4 + MT5 Compatibility: ✅
- Free Updates: ✅
- Support Access: ✅ Priority
- Avg. Monthly Cost: 💸 One-time
Ready to stop guessing with RSI? Try RSI Boss now and trade with real precision.
✅ Works on MT4 and MT5 with any broker
✅ Ideal for prop firms, scalpers, swing traders
✅ Instant download – zero stress
How to Avoid RSI False Signals?
False signals are the Achilles’ heel of most retail strategies. With traditional RSI, especially the classic 70/30 setup, you’ll often get a signal that looks promising, only for the price to reverse just after you enter.
Here’s where RSI Boss stands out. Instead of waiting for the price to touch 70 or 30, RSI Boss helps you assess pressure zones early with its 55 and 45 buffers. These give you a tighter read on momentum shifts before the market makes its move.
I’ve personally used it to spot fake breakouts on Gold and EURUSD. A candle may spike past a level, but RSI Boss won’t confirm it with strength across all timeframes. That’s my red flag to wait.
[Insert chart here: Show a failed breakout with RSI Boss not confirming the move]
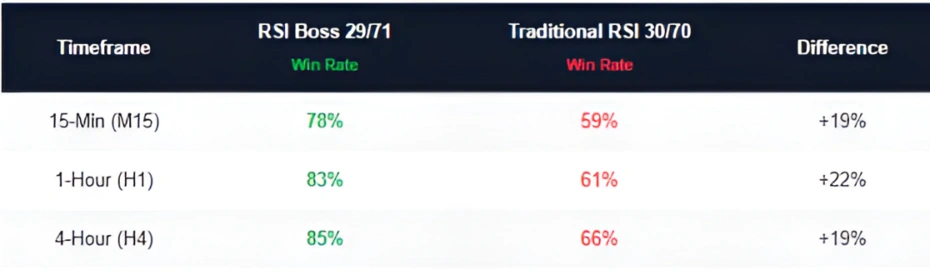
What Is the Most Accurate RSI Setting?
This is where opinion meets experience.
In my 17 years of trading, I’ve tested countless variations: 5, 7, 10, 14, even 2-period RSI (used in RSI2 strategy). But no setting has given me more clarity than RSI Boss’s restructured zone system: 71, 55, 45, and 29.
It’s not just about changing the length, it’s about redefining how you read RSI levels. By adding two middle lines (55 and 45) and recalibrating the oversold/overbought edges, you get a tool that thinks like a trader, not a textbook.
What Is a False Breakout?
A false breakout happens when the price breaches a key level (support, resistance, or trendline) and quickly reverses, trapping traders.
RSI Boss can help filter these out:
- If price breaks out but RSI doesn’t move past 55 or 45, be cautious.
- If higher timeframes still show weakness, that breakout might be a trap.
This saved me more than once, especially on pairs like GBPJPY and indices like NAS100.
Final Thoughts
RSI Boss isn’t just another indicator; it’s a mindset shift.
I’ve used dozens of RSI tweaks over the years, from Reddit hacks to premium indicators, and most of them just repackage the same signals. RSI Boss is different. By breaking the 50 line into 45 and 55, and refining the traditional 30/70 levels to 29 and 71, it gives you a better read on momentum and a clearer edge in real trades.
It offers a smarter framework based on probability zones, multi-timeframe agreement, and real-time momentum windows.
So, if you’ve ever felt RSI was “almost right but a little late,” this fixes that. It’s one of those tools that earns its place on your chart, not because it’s colorful, but because it works.
No indicator is perfect, but this one can help you stay profitable if you follow the rules I’ve laid out here.
So, if you’re serious about taking cleaner trades with fewer fakeouts, and you’re tired of “out-of-the-box” tools that never deliver, RSI Boss is worth a spot in your chart arsenal.
🔥 Limited Offer: Try RSI Boss Now
Use my affiliate link below to download RSI Boss and gain access to strategy, and real chart breakdowns.
👉 Download RSI Boss Indicator – Try it Here
💳 Crypto Payments Alternative
Prefer to pay with crypto? We’ve got you covered.
We accept cryptocurrency payments through our secure checkout system.
To use this option, simply make a request, and you’ll receive the wallet address with the exact amount and currency details.
Disclaimer
RSI Boss is a custom-built tool for MT4/MT5 designed to assist with technical analysis. It does not guarantee profitable trades or eliminate market risk. Always use your own judgment, and trade with proper risk management. Past performance is not an indication of future results.


Interesting points about optimizing gameplay! It’s smart to consider performance tracking – platforms like mumu player download apk are really focusing on that now, offering advanced analytics for a competitive edge. Good read!
k93hse
576riz
5bn9rm
I have read some good stuff here. Definitely value bookmarking for revisiting. I surprise how a lot attempt you put to make this kind of fantastic informative web site.
0lma3d